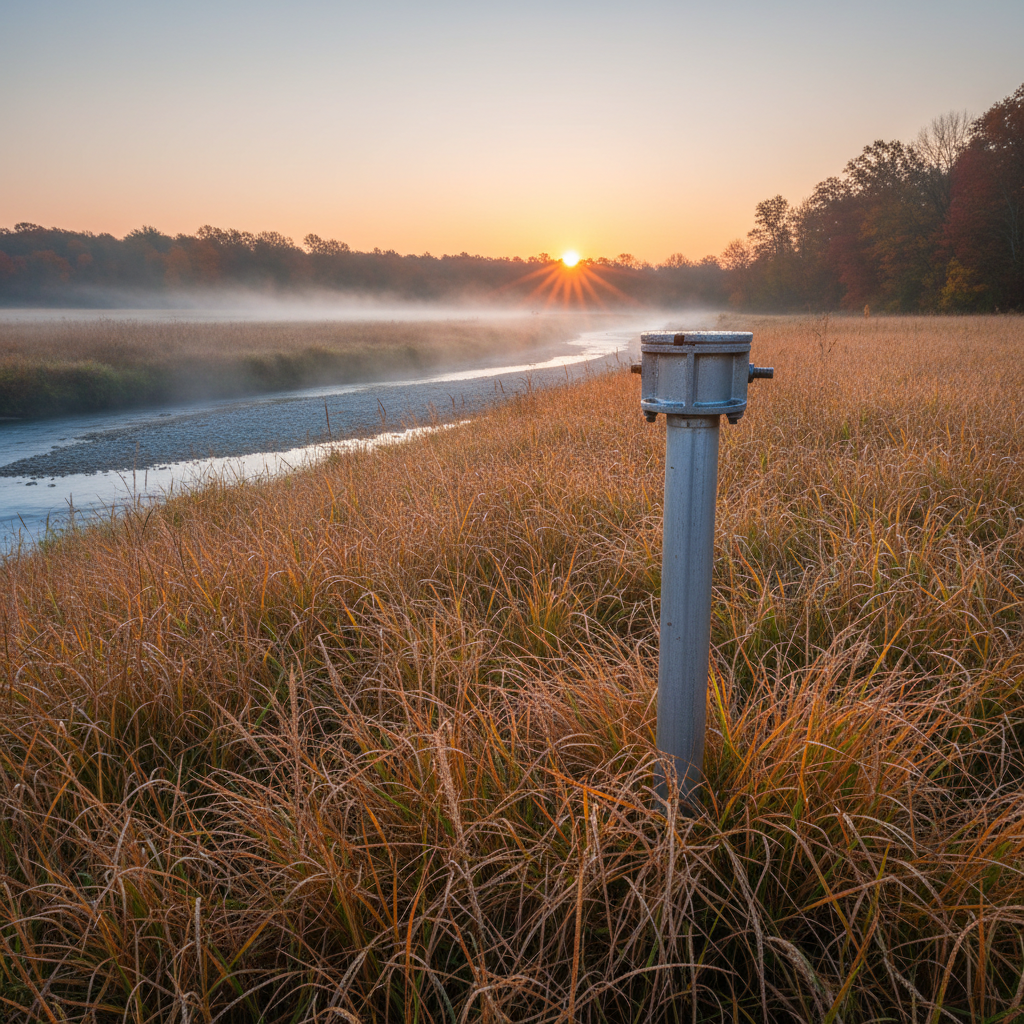
Buried sensor networks reading the pulse of alluvial aquifers — delivering the subsurface clarity that water districts, consultants, and cooperatives need to act before the water table tells them itself.
Alluvial Placement
Sensors buried at depth-calibrated intervals matching local stratigraphy
Continuous Telemetry
15-minute intervals, cellular uplink, sub-centimeter pressure resolution
Compliance-Ready
Data formatted for USGS NWIS, state agency submissions, and court filings
Seasonal Intelligence
Four-season baselines built over 2–5 year deployment windows
When the aquifer quietly fills.
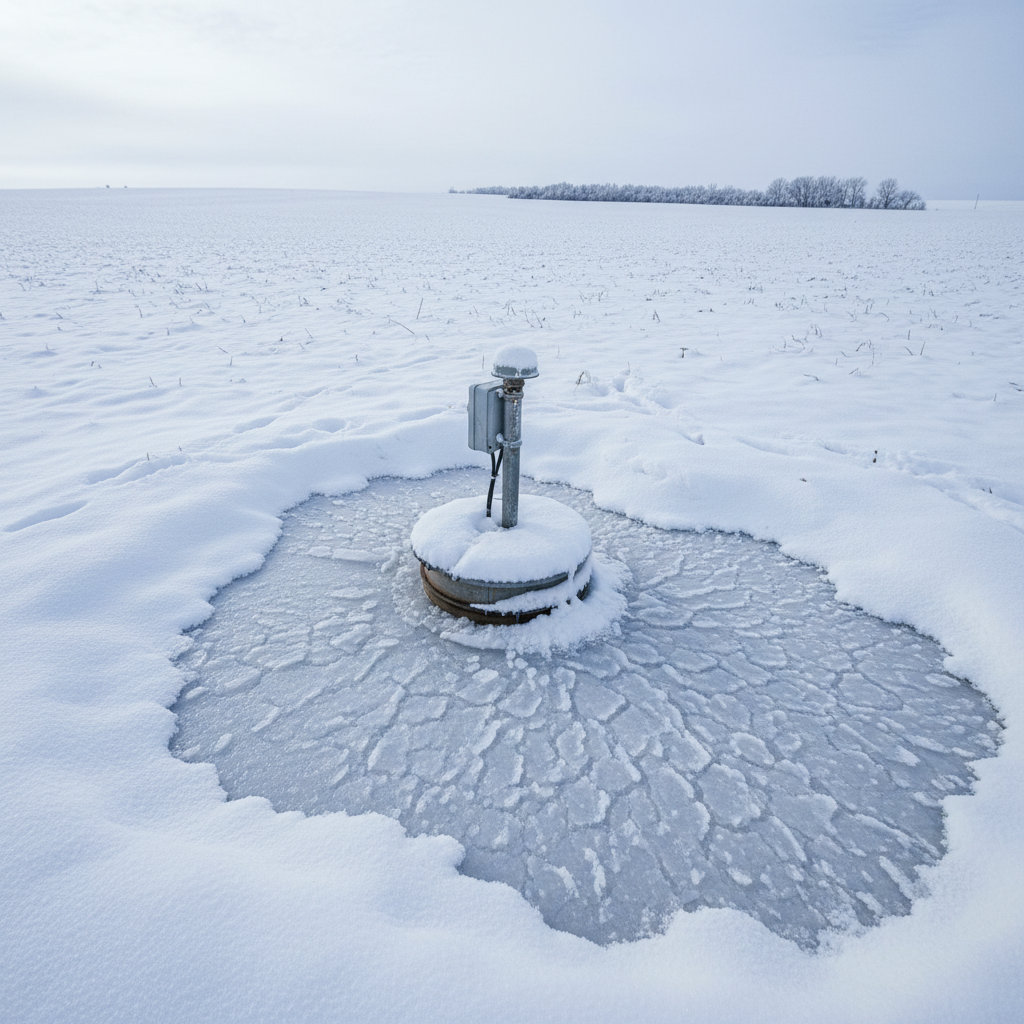
Weld County, Colorado
High Plains Snowpack Recharge Study
Identified 4.2-inch equivalent recharge from December snowmelt, revising drought-year storage projections by 18%.
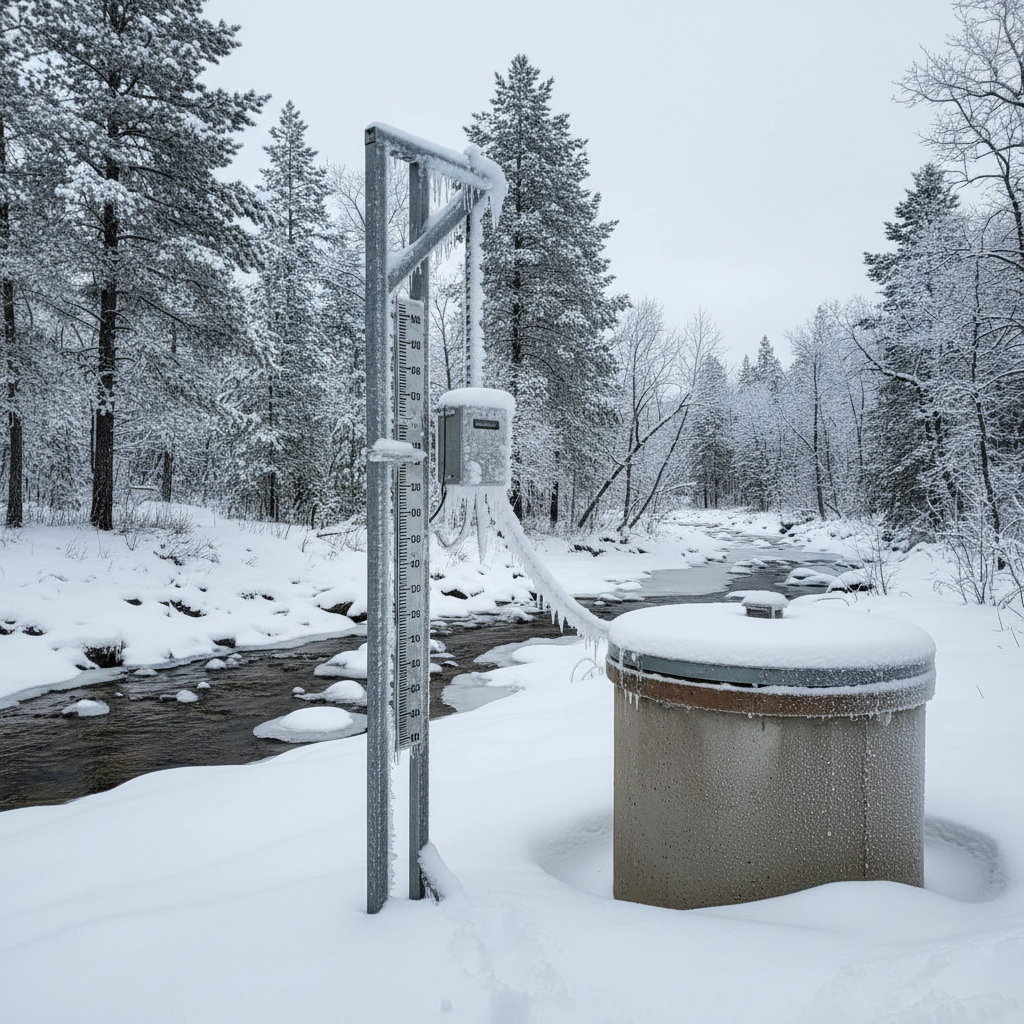
Lane County, Oregon
Willamette Basin Winter Baseflow
Confirmed groundwater-surface water exchange maintaining 0.8 cfs baseflow through 60-day no-precipitation window.
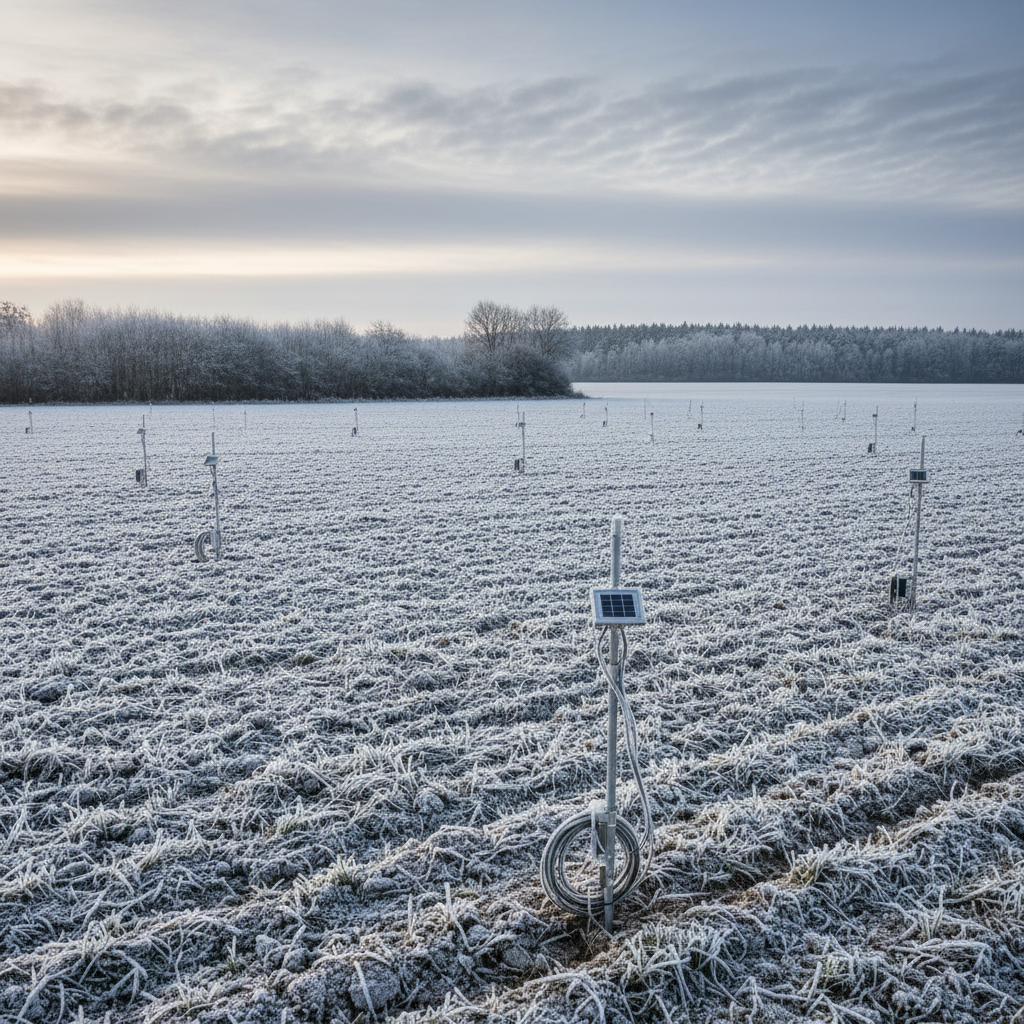
Finney County, Kansas
Ogallala Recharge Rate Verification
Net recharge measured at 0.4 inches per year, confirming regional depletion model used in Kansas water rights adjudications.
The ground absorbs what the sky releases.
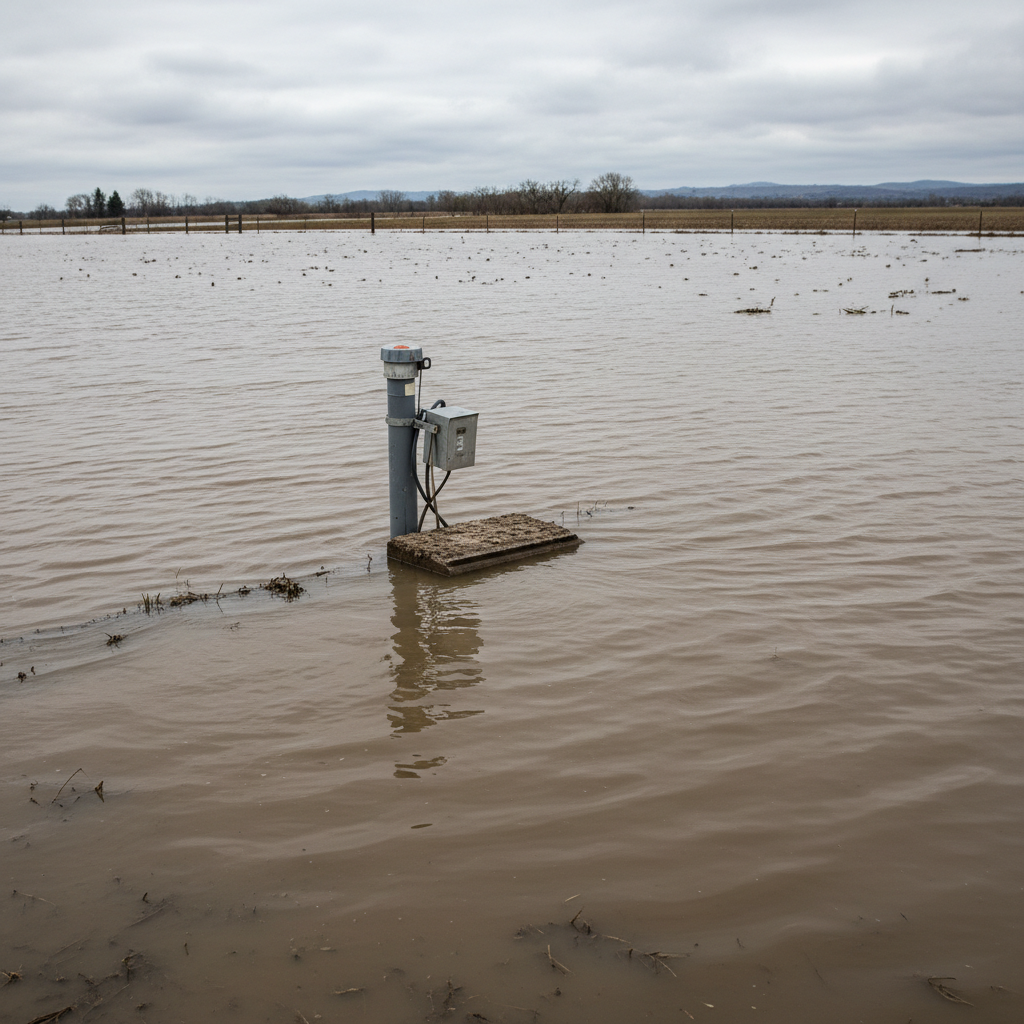
Glenn County, California
Sacramento Valley Meltwater Infiltration
Captured 6-day lag between surface flood event and measurable water table response at 80-foot depth, validating managed aquifer recharge site selection.
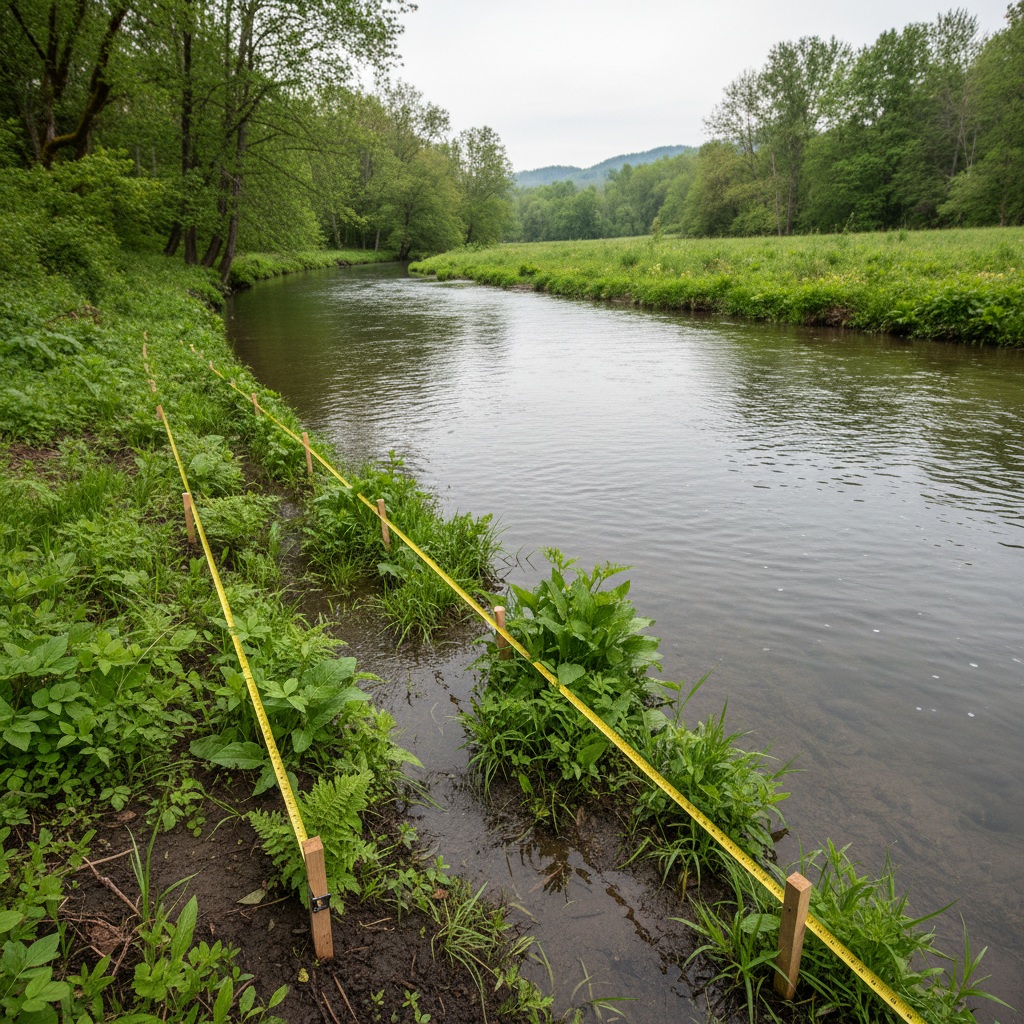
Hall County, Nebraska
Platte River Riparian Recharge Corridor
Mapped 1.2-mile recharge corridor where spring river stage drives 3-foot water table rise within 48 hours, informing Whooping Crane habitat protection boundaries.
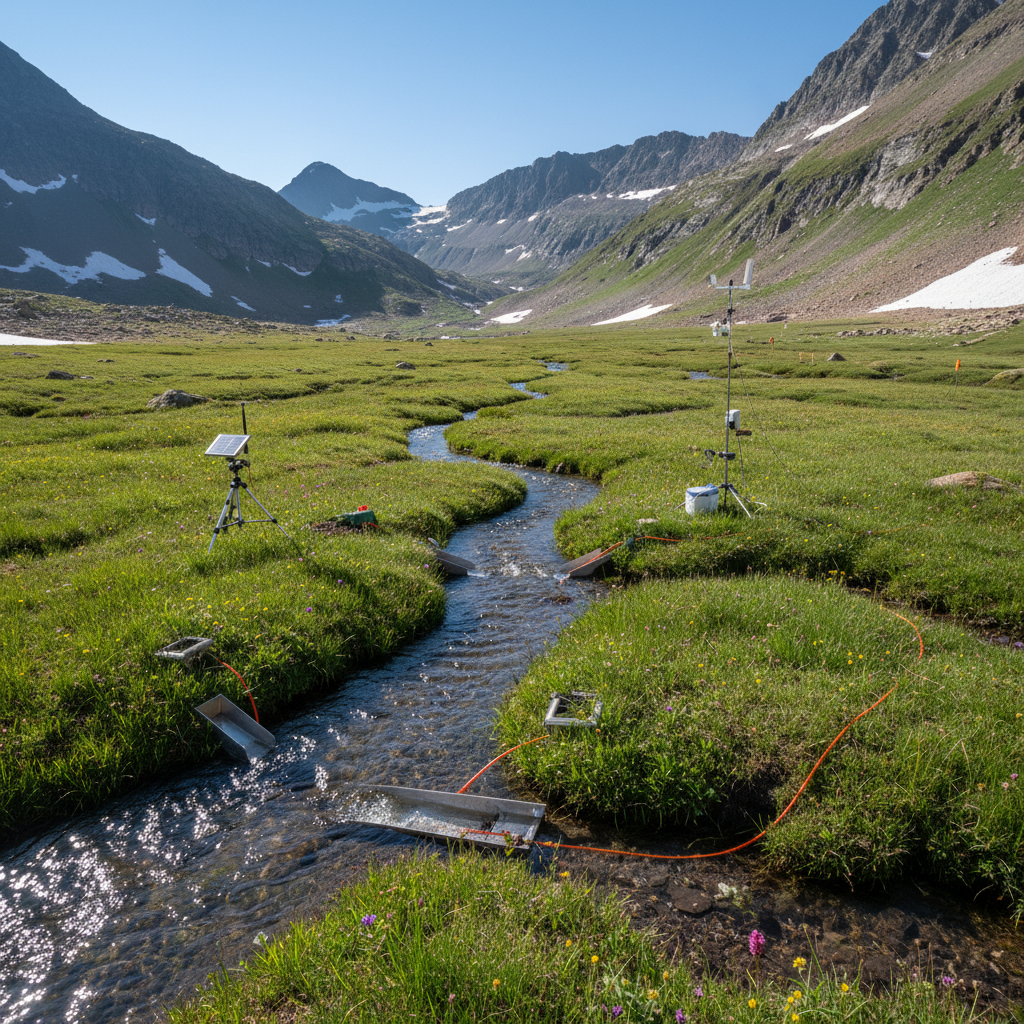
Okanogan County, Washington
Methow Valley Snowmelt Timing Study
Documented 12-day earlier peak recharge compared to 1990s baseline, quantifying climate shift impact on summer irrigation availability.
The aquifer doesn't announce its limits. Your sensors do.
Without continuous telemetry, drawdown during peak irrigation season is invisible until a well fails or a drought declaration arrives weeks too late. The difference between 12 days of warning and no warning is a sensor at depth.
Average warning window our network provides before critical thresholds
Of monitored wellfields avoided emergency pumping restrictions in 2024
Real-time drawdown curves synchronized with drought declaration triggers.
Export-ready datasets in USGS and state agency formats, timestamped and defensible.
Salinity front tracking at root-zone depth, updated every 15 minutes.
Live Drawdown Monitor
Peak irrigation season — July 15, 2025
67 ft
drawdown
90 ft
drawdown
33 ft
drawdown
25 ft
drawdown
Drawdown depths updated every 15 minutes. Data shown is illustrative of live network output format.
Explore a Monitoring Partnership
Every watershed has a question only the water table can answer. We help you hear it — before drought declarations, compliance deadlines, or crop failures make the silence costly.
What a partnership includes
Site assessment and sensor array design within 30 days
Installation by certified hydrogeologists, not subcontractors
Live dashboard access from day one of deployment
Quarterly seasonal briefings and annual trend reports
Data formatted for your regulatory authority on request
The water table climbs back. We measure every inch.
Typical Annual Cycle
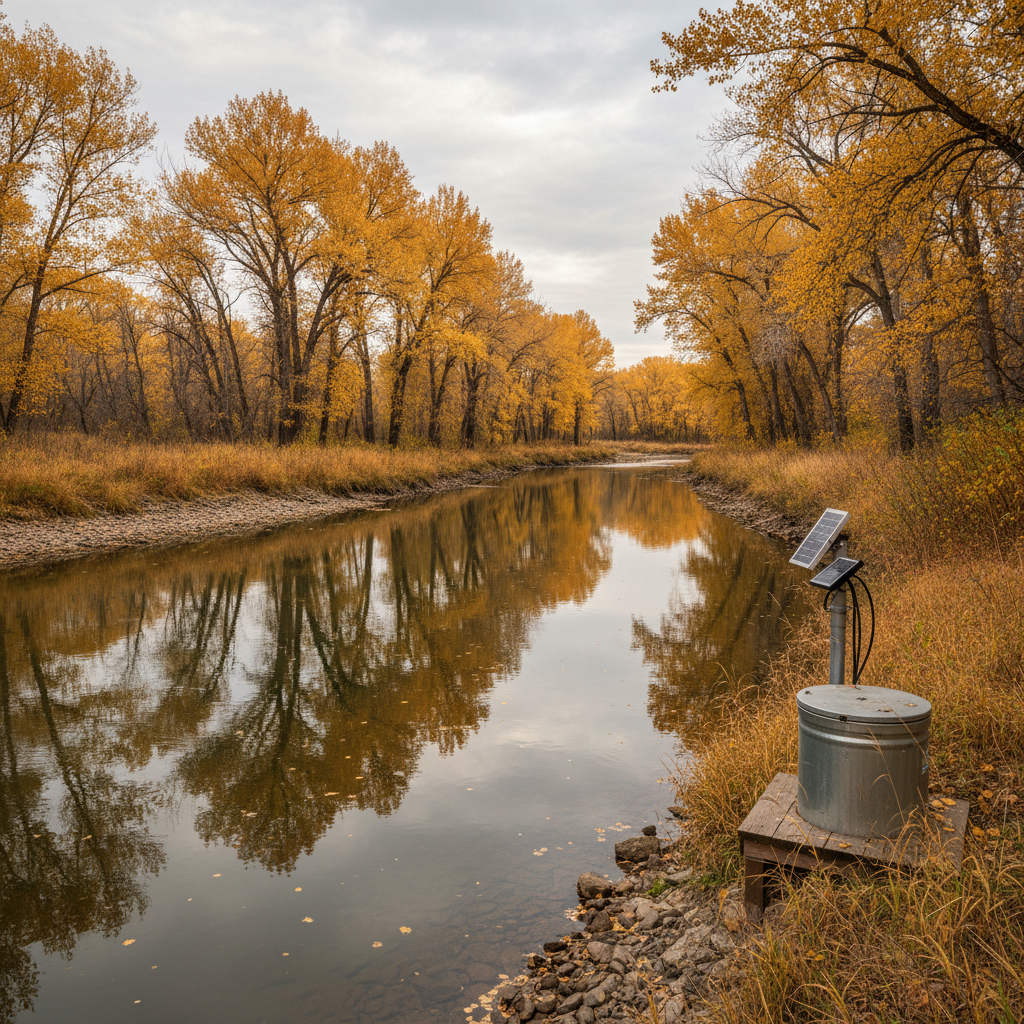
Tulare County, CA
Central Valley Autumn Rebound
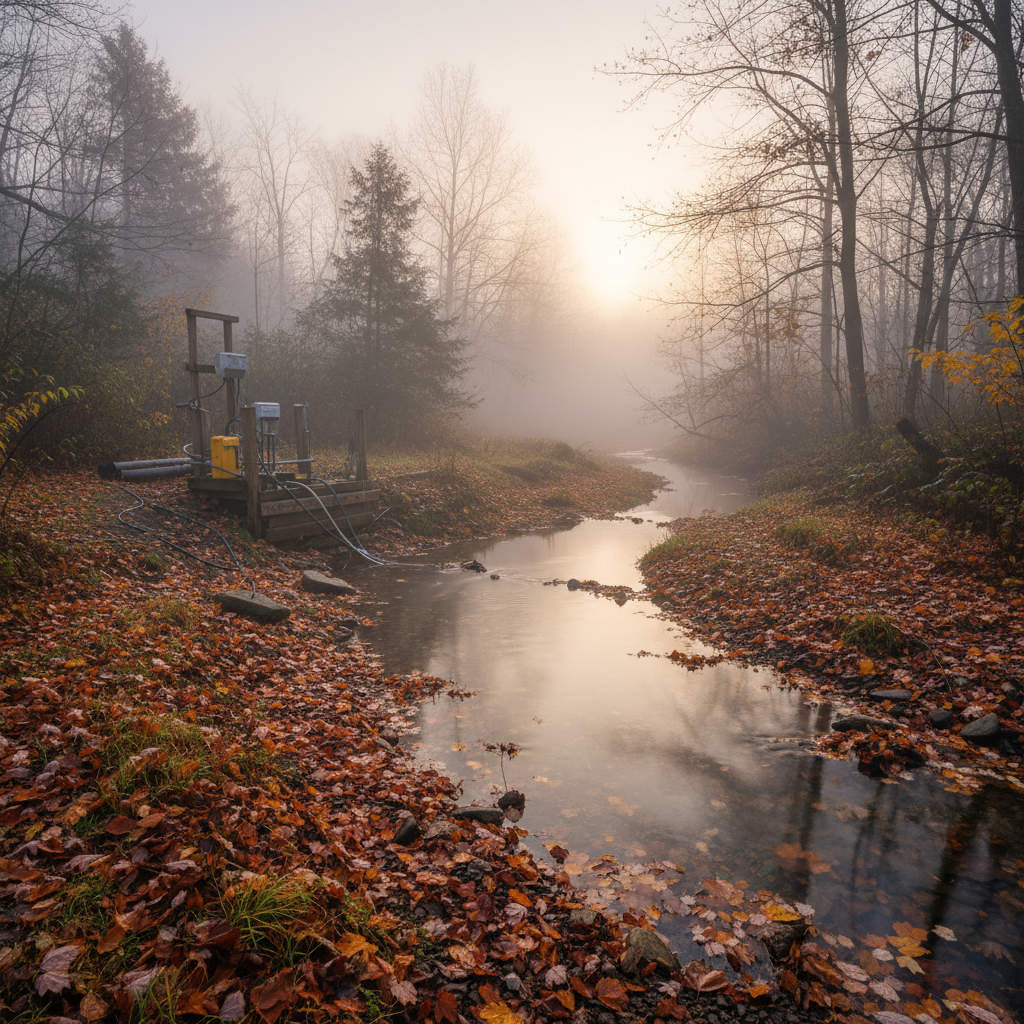
Post-irrigation recovery tracked for the first time over a full 14-week autumn window, confirming aquifer storage capacity sufficient for consecutive drought years.
Dundy County, NE
Republican River Compact Verification
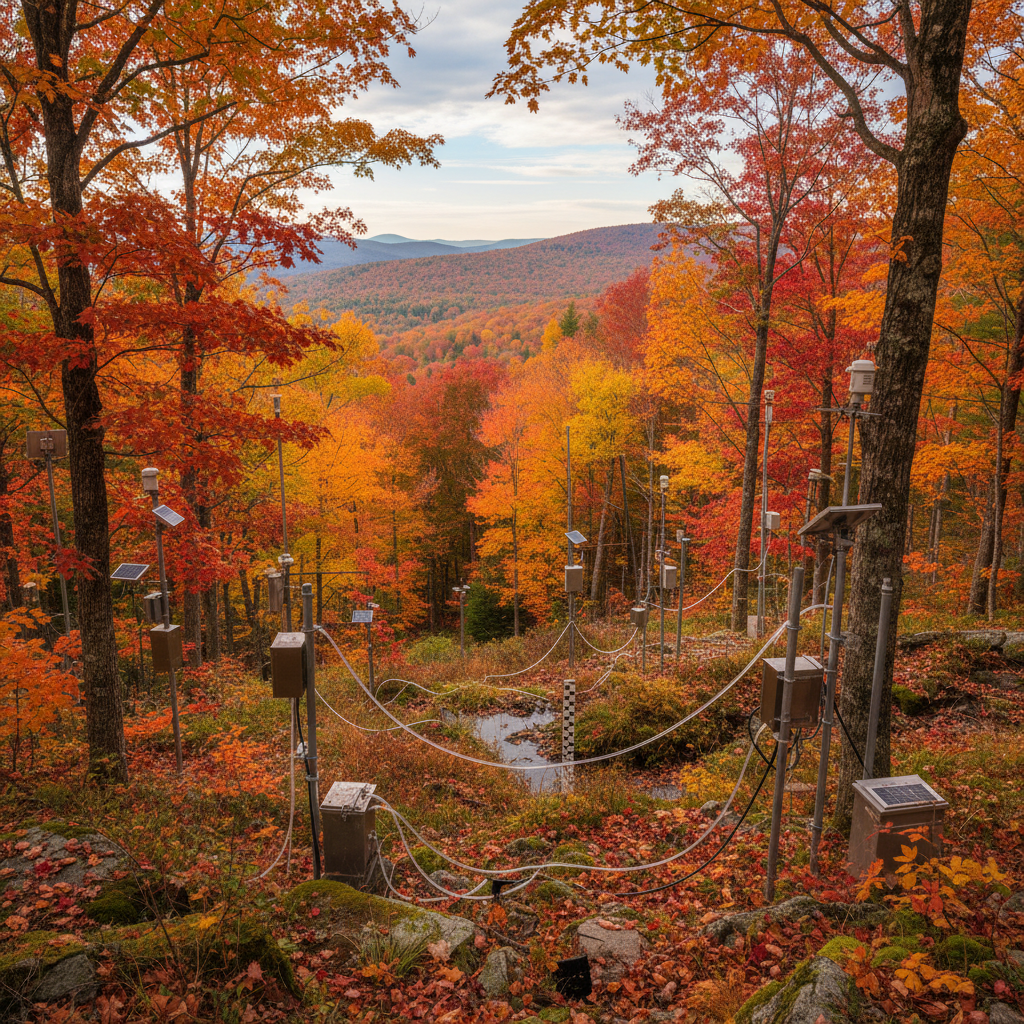
Autumn data provided independent verification of compact-required recovery rates, avoiding $3.2M in interstate compact penalty exposure.
Douglas County, OR
Umpqua Basin Recovery Profile
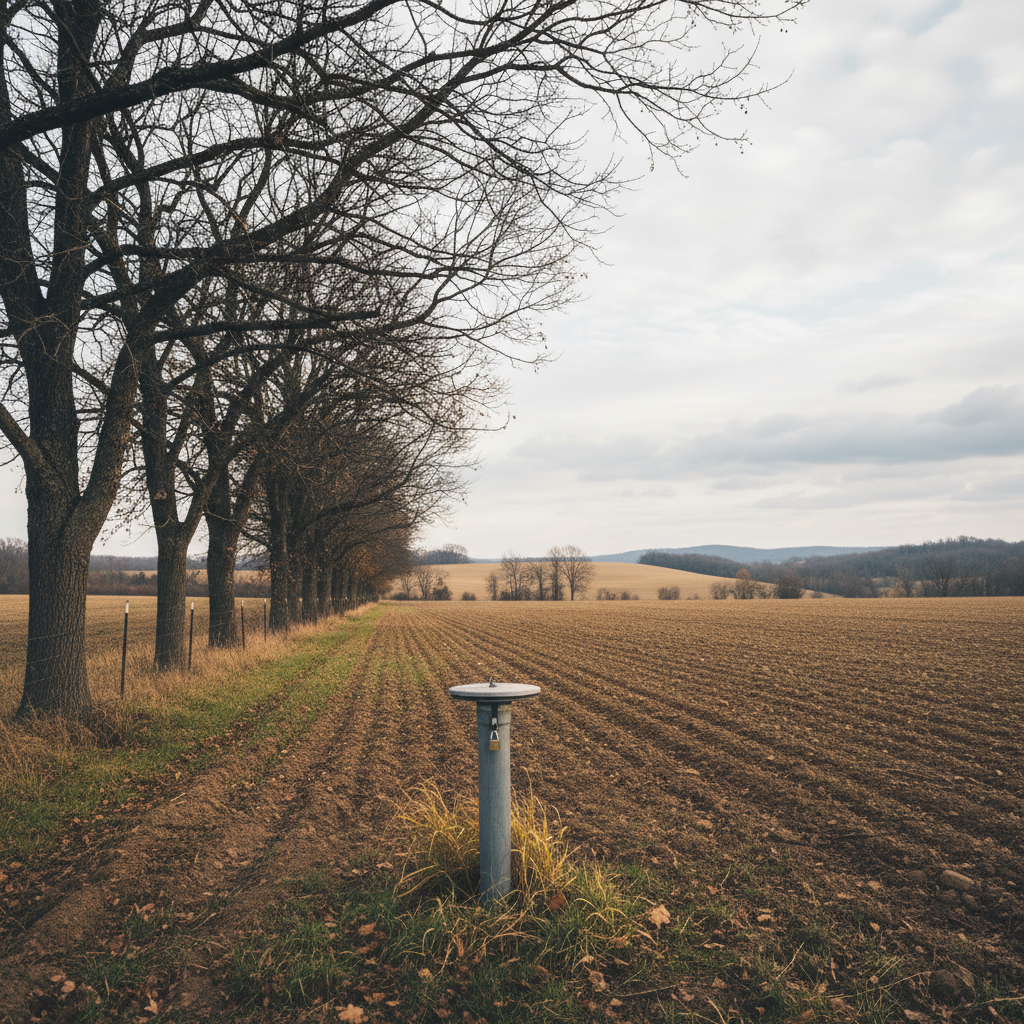
Rapid autumn recovery identified as indicator of healthy riparian connectivity, supporting habitat designation petition to ODFW.
Malheur County, OR
High Desert Salinity Front Retreat
Salinity front documented retreating 340 feet from root-zone depth over 22-week autumn recovery, enabling crop rotation planning for following spring.
Download the Seasonal Data Brief
Twelve pages of methodology, sensor specifications, calibration protocols, and sample outputs from three active networks. Study the approach at your own pace.